


AronRa’s geology video on Noah’s Flood is wrong
A friend asked for help to refute a video about geology by atheist AronRa, who is desperate to disprove Noah’s Flood. AronRa has lots of videos on this exact theme from many different angles. You can find them by Googling. … Continued
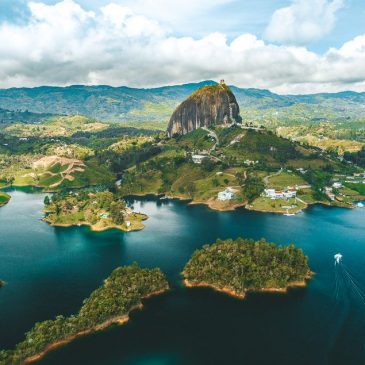
The formation of La Piedra Del Peñol, Colombia
One thrill about being a geologist with Creation Ministries International is that people ask about amazing places all over the world. I get to ‘travel’ the globe with a purpose. Someone asked today if I knew about La Piedra Del … Continued

1000 feet of Permian sediments removed from the Canberra region, Australia
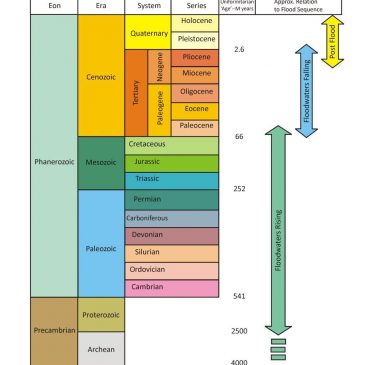
One interesting feature of the rocks around Canberra is that they are confined to a small time-interval on the geological column, that is from the Middle Ordovician to the Late Silurian (see figure 1 for the location of these rocks … Continued
The geological history of Canberra, Queanbeyan and Environs
Recently, I visited Canberra, Australia, and checked some of the geological information about that region. I wanted to understand where the rocks around Canberra fitted with Noah’s Flood. Canberra is the federal capital city of Australia where the houses of … Continued
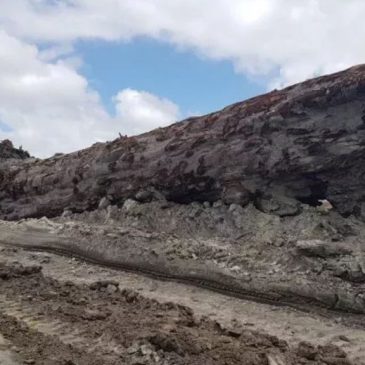
Giant kauri tree unearthed in New Zealand was ripped up and buried by Noah’s Flood
News reports in March 2019 featured an enormous kauri tree (Agathis australis) unearthed at New Zealand’s Ngawha geothermal power station site some 180 km north-north west of Auckland (just 5 km east of Kaikohe).1 In February 2019, it was found … Continued
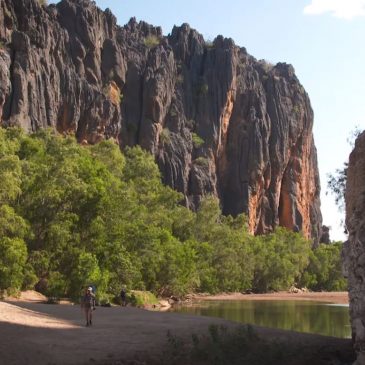
Windjana Gorge, Western Australia, was not an ancient barrier reef
Recently, a friend asked if I knew about Windjana Gorge in the north of Western Australia. He said, “It is on the Gibb River road in the Kimberley and the information there said the cliffs were a reef. It was … Continued

Enormous volcanic cataclysm engulfed most of northern Australia during Noah’s Flood
The adjacent figure is a small extract from a geological map of the area around Kellys Knob, Kununurra, Western Australia. Whenever I visit a new area, I spend much time poring over geological maps, which are available free as images … Continued

What do the fossilized ripples preserved on sandstone layers on Kellys Knob, Kununurra, mean?
Here are two examples of fossilized ripples preserved on the sandstone layers up Kellys Knob, just north of Kununurra, Western Australia. There are many examples on the surfaces of the rocks. These ripples indicate that the sediment was deposited from … Continued

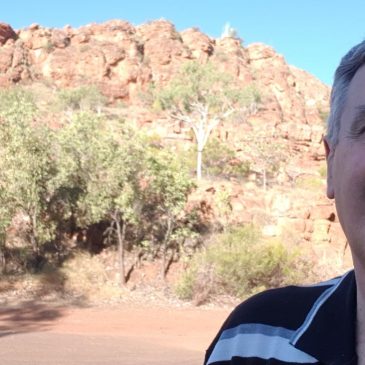
Why is the Ord River Valley near Kununurra, Western Australia, so wide and flat?
Figure 1 is a view from Kellys Knob looking south-west across the Ord River valley, which is wide and flat. Some Kununurra streets and houses are visible in the foreground. Further back you can see the Kununurra Airport. And beyond … Continued
Kellys Knob, Kununurra, is an erosional survivor
This prominent hill just north of the town of Kununurra in the Kimberley in Western Australia is called Kellys Knob (aka Thegoowiyeng). It rises some 190 metres above the surrounding plain and gives great views of the area around Kununurra. … Continued